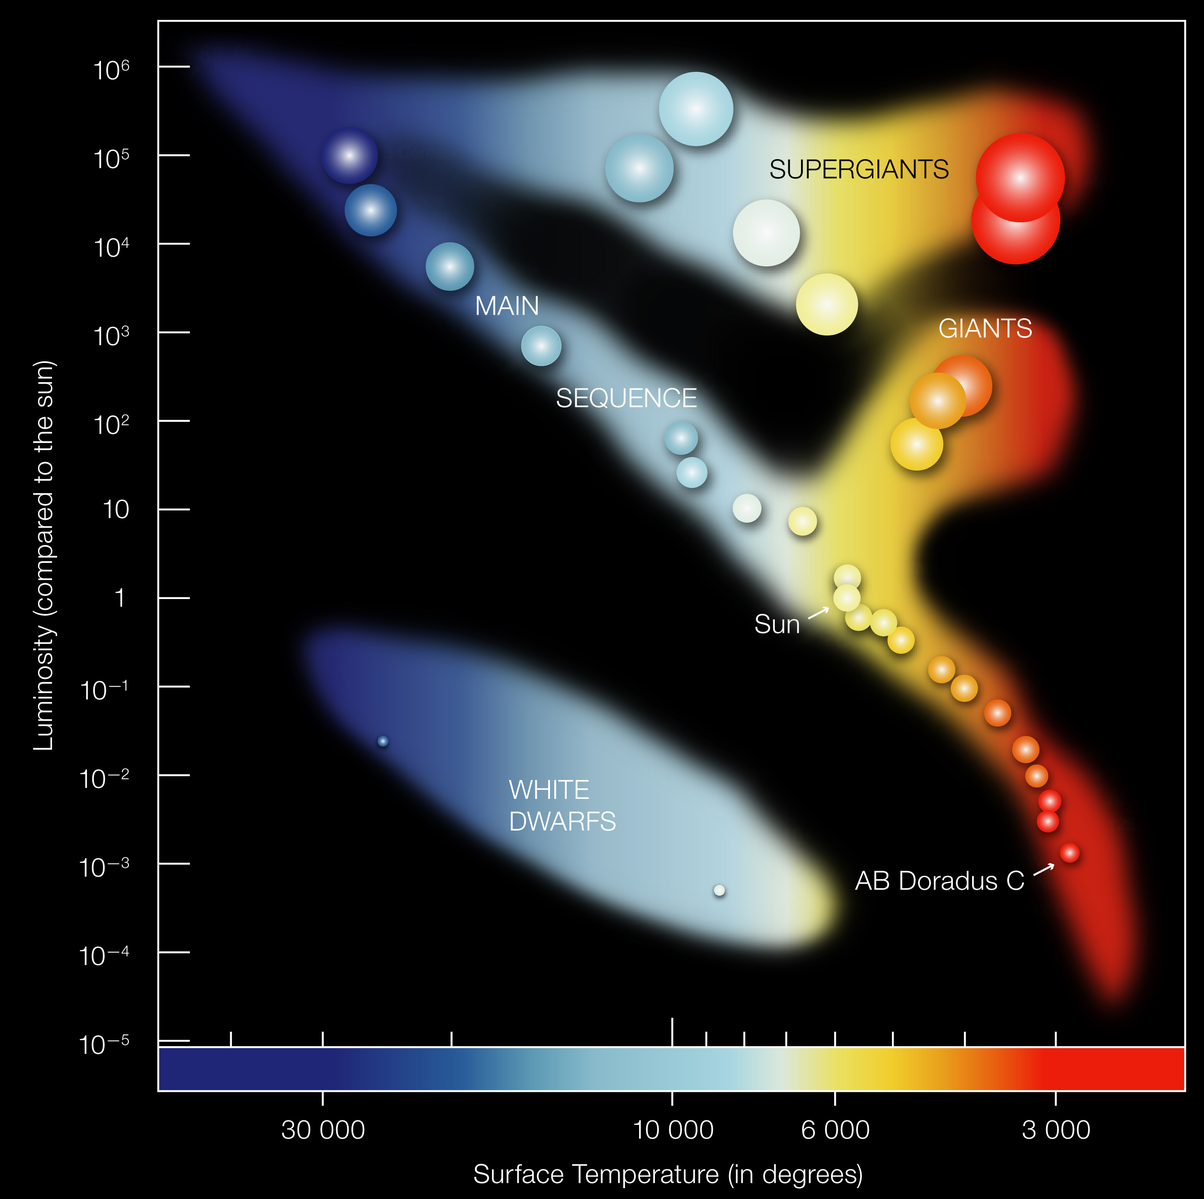
The Hertzsprung-Russell (Hertzsprung-Russell ) diagram is a graph that plots the luminosity and temperature of stars. It is named after the Danish astronomer Ejnar Hertzsprung and American astronomer Henry Norris Russell, who independently developed the diagram in the early 1900s. The Hertzsprung-Russell diagram has since become a fundamental tool in stellar astronomy, helping scientists to understand the evolution and behaviour of stars.
Construction of the Hertzsprung-Russell diagram is based on the relationship between a star’s surface temperature and its luminosity. Temperature is plotted on the horizontal axis, while luminosity is plotted on the vertical axis, using a logarithmic scale. The position of a star on the diagram depends on its intrinsic brightness, which is a combination of its distance from Earth and its actual luminosity.
Stars fall into different regions on the Hertzsprung-Russell diagram depending on their spectral class, which is determined by the elements present in their spectra. The main sequence, located diagonally from the upper left to the lower right of the diagram, contains the majority of stars and is characterised by a balance between the gravitational force pulling inward and the fusion reactions pushing outward. Red giants and supergiants occupy the upper right portion of the diagram, while white dwarfs are located in the lower left.
The Hertzsprung-Russell diagram is a powerful tool for studying stars because it can reveal their mass, age, chemical composition, and evolutionary stage. For example, by comparing the position of a star on the Hertzsprung-Russell diagram to theoretical models, astronomers can estimate its age and mass. Additionally, by analysing the distribution of stars in different regions of the Hertzsprung-Russell diagram, astronomers can learn about the structure and evolution of galaxies.
The development of the Hertzsprung-Russell diagram
The Hertzsprung-Russell (Hertzsprung-Russell ) diagram is one of the most important tools in astronomy, allowing scientists to understand the properties and behaviour of stars. The development of the Hertzsprung-Russell diagram was a major milestone in the history of astronomy, and it has played a key role in shaping our understanding of the cosmos.
The Hertzsprung-Russell diagram was independently developed by two astronomers: Ejnar Hertzsprung and Henry Norris Russell. Hertzsprung, a Danish astronomer, was studying the stars in the Hyades cluster, which is located in the constellation Taurus. He noticed that the brighter stars in the cluster tended to be cooler than the fainter stars. This observation was surprising, as it was expected that brighter stars would be hotter, according to the Stefan-Boltzmann law.
Around the same time, Russell, an American astronomer, was studying the spectra of stars. He realised that the strength of certain spectral lines could be used to determine the surface temperature of a star. Russell also knew that a star’s luminosity was related to its surface area and temperature. He realised that by combining these two pieces of information, he could create a graph that would show the relationship between a star’s luminosity and temperature.
In 1913, Hertzsprung published a graph showing the relationship between the brightness and colour of stars in the Hyades cluster. This graph is considered to be the first Hertzsprung-Russell diagram. Russell also developed a similar diagram independently, which he published in 1914.
The first Hertzsprung-Russell diagrams were not as refined as the ones used today. The original diagrams used the apparent magnitude of stars (a measure of their brightness as seen from Earth) instead of their absolute magnitude (a measure of their intrinsic brightness), and they did not take into account the effects of interstellar dust on starlight.
Over the years, astronomers have refined the Hertzsprung-Russell diagram by using more accurate measurements of stars’ luminosities and temperatures, and by accounting for the effects of dust and other factors. Today, the Hertzsprung-Russell diagram is a powerful tool that allows astronomers to classify stars by their temperature, luminosity, and spectral type, and to understand their properties and evolution.
The Hertzsprung-Russell diagram has been used to make many important discoveries in astronomy. For example, it has helped scientists to understand the life cycles of stars, the structure of galaxies, and the history of the universe. It has also provided evidence for the existence of dark matter, and has helped astronomers to identify and study exoplanets.
In conclusion, the development of the Hertzsprung-Russell diagram was a major milestone in the history of astronomy. Hertzsprung and Russell’s work paved the way for a better understanding of the properties and behaviour of stars, and their diagram continues to be a key tool for astronomers today. Through ongoing refinement and development, the Hertzsprung-Russell diagram will undoubtedly continue to play an important role in shaping our understanding of the universe.
key features of the Hertzsprung-Russell diagram
The Hertzsprung-Russell (Hertzsprung-Russell ) diagram is a graph that plots the luminosity and temperature of stars, and it is one of the most important tools in astronomy. The Hertzsprung-Russell diagram has several key features that allow astronomers to classify stars and understand their properties and evolution. Here are some of the main features of the Hertzsprung-Russell diagram:
The main sequence
The main sequence is the diagonal band that runs from the upper left to the lower right of the Hertzsprung-Russell diagram. This band contains the majority of stars and represents the phase in a star’s life when it is fusing hydrogen into helium in its core. The luminosity and temperature of stars on the main sequence depend on their mass, with more massive stars being hotter and brighter.
Red giants and supergiants
Stars that have exhausted their hydrogen fuel and have begun fusing heavier elements occupy the upper right portion of the Hertzsprung-Russell diagram. These stars are much larger and more luminous than main-sequence stars, and they have cooler surface temperatures.
White dwarfs
Stars that have exhausted all of their nuclear fuel and have collapsed to become extremely dense objects occupy the lower left portion of the Hertzsprung-Russell diagram. These stars are very small and have high surface temperatures, but they are very faint because they no longer produce energy through nuclear fusion.
Spectral types
The Hertzsprung-Russell diagram can be divided into regions that correspond to different spectral types of stars. Spectral type is a classification system that is based on the presence of certain elements in a star’s spectrum. The regions on the Hertzsprung-Russell diagram that correspond to different spectral types are known as the O, B, A, F, G, K, and M spectral classes.
Evolutionary tracks
By comparing the position of a star on the Hertzsprung-Russell diagram to theoretical models, astronomers can determine its evolutionary stage and predict how it will change over time. Evolutionary tracks show the path that a star will take on the Hertzsprung-Russell diagram as it ages and its properties change.
Isochrones
Isochrones are curves on the Hertzsprung-Russell diagram that connect stars of the same age. They allow astronomers to determine the age of a group of stars by comparing their positions on the Hertzsprung-Russell diagram to theoretical models.
In conclusion, the Hertzsprung-Russell diagram has several key features that allow astronomers to classify stars, understand their properties, and predict their evolution. By studying the positions of stars on the Hertzsprung-Russell diagram, astronomers can learn about the life cycles of stars, the structure of galaxies, and the history of the universe. The Hertzsprung-Russell diagram remains a vital tool in the field of astronomy, and ongoing research continues to refine our understanding of the diagram and its applications.
The main sequence
The main sequence is a fundamental feature of the Hertzsprung-Russell (Hertzsprung-Russell ) diagram, which plots the luminosity and temperature of stars. The main sequence is a diagonal band that runs from the upper left to the lower right of the Hertzsprung-Russell diagram and contains the majority of stars.
The position of a star on the main sequence depends on its mass. Stars with higher masses are hotter and more luminous than stars with lower masses. Therefore, more massive stars are found in the upper left portion of the main sequence, while lower-mass stars are found in the lower right portion.
The main sequence represents the phase in a star’s life when it is fusing hydrogen into helium in its core. This process releases energy and causes the star to shine. The luminosity and temperature of stars on the main sequence depend on their mass and age, with more massive and younger stars being hotter and brighter than less massive and older stars.
The main sequence is an important feature of the Hertzsprung-Russell diagram because it provides a way for astronomers to classify stars and understand their properties. By measuring a star’s luminosity and temperature and comparing it to the positions of other stars on the main sequence, astronomers can determine its mass, age, chemical composition, and other characteristics.
The main sequence is also important because it represents the longest phase in a star’s life. Stars spend the majority of their lives on the main sequence, fusing hydrogen into helium in their cores. The length of time a star spends on the main sequence depends on its mass, with more massive stars spending less time on the main sequence than lower-mass stars.
In conclusion, the main sequence is a fundamental feature of the Hertzsprung-Russell diagram that allows astronomers to classify stars and understand their properties. The main sequence represents the phase in a star’s life when it is fusing hydrogen into helium in its core, and it is the longest phase in a star’s life. The main sequence remains a key area of study for astronomers, as ongoing research continues to deepen our understanding of the properties and behaviour of stars.
Is the Hertzsprung-Russell diagram useful for amateur astronomers
The Hertzsprung-Russell diagram is a powerful tool used by professional astronomers to study stars, but it can also be useful for amateur astronomers who are interested in observing and understanding the properties and behaviour of stars. While amateur astronomers may not have access to the same sophisticated equipment and data as professional astronomers, they can still use the Hertzsprung-Russell diagram to gain insights into the stars they observe.
One way in which amateur astronomers can use the Hertzsprung-Russell diagram is to classify stars based on their spectral type. Spectral type is a classification system that is based on the presence of certain elements in a star’s spectrum. By observing the spectrum of a star and comparing it to the spectral types on the Hertzsprung-Russell diagram, amateur astronomers can determine the spectral type of the star they are observing. This can provide information about the temperature, luminosity, and other properties of the star.
Another way in which amateur astronomers can use the Hertzsprung-Russell diagram is to learn about the life cycles of stars. By understanding the position of stars on the Hertzsprung-Russell diagram, amateur astronomers can learn about the different phases in a star’s life, including the main sequence, red giant phase, and white dwarf phase. This can provide insights into the evolution and behaviour of stars.
Amateur astronomers can also use the Hertzsprung-Russell diagram to study star clusters. Star clusters are groups of stars that formed together and have similar ages and chemical compositions. By plotting the stars in a cluster on the Hertzsprung-Russell diagram, amateur astronomers can learn about the properties and behaviour of the stars in the cluster.
In conclusion, while the Hertzsprung-Russell diagram is primarily used by professional astronomers, it can also be a useful tool for amateur astronomers who are interested in studying stars. By using the Hertzsprung-Russell diagram to classify stars, study star clusters, and learn about the life cycles of stars, amateur astronomers can gain insights into the properties and behaviour of the stars they observe.
Conclusion
The Hertzsprung-Russell diagram is an important tool for astronomers to study stars and their evolution. Its construction and interpretation have been refined over the years, but the fundamental principles behind it remain the same. By mapping the stars on the Hertzsprung-Russell diagram, scientists can unlock the secrets of the cosmos and deepen our understanding of the universe.